Cool guys.

Stock market barometer. Six years ago, Professor Rudi Zagst of the Technical University of Munich (left) developed a scientific model that measures the probability of stock market turbulence. Together with the evil professional Oliver Schlick, he is now working on transferring the information into an investment model. Science meets financial experience - the two of them could not have chosen a better moment for it.
{mprestriction ids="*"}
"I had never seen anything like it before in the field of science," says Oliver Schlick, former Chief Investment Officer of BayernInvest, still amazed. "Rudi Zagst's seismograph has not only anticipated all the crises of the last 15 years with sufficient lead time. It also indicates when the danger is over. And avoid the gruelling losses that many quantitative strategies produce in sideways phases."
When Schlick decided two years ago to focus more on consulting and science, he was convinced that he had to try to turn the scientific model into an action strategy that could be put into practice. "And you know what? We finished just in time."
{mprestriction ids="1"}After years of stable high pressure on the stock market, Schlick says, the hurricane season is now beginning. "There will be good market phases in the next few years. But also massive setbacks. A stock market seismograph is therefore more valuable today than ever before."
For Rudi Zagst, Head of the Chair of Financial Mathematics at the Technical University of Munich, the financial crisis gave the impetus to develop an early warning system for the stock exchange. "1987, 2000, 2008 - time and time again the world is completely surprised by price falls on the stock markets. I was wondering: Why, despite all our knowledge, do we not succeed in developing something that warns of crises on the capital markets in good time?
Zagst is about to change that. With two of his students, an employee and a team of financial market experts, he develops a kind of weather forecast for the stock exchange. He is not interested in forecasting the development of the DAX or any other index. "We wanted to build a model that would indicate the probability of a thunderstorm in the markets. So that every investor can check his positioning. Is the market still safe enough for me? Do I consciously take the obvious risks and take an umbrella with me? Or am I changing my portfolio structure?"
Because the best data material with the longest history is available in the USA, the model for the US stock market S&P 500 is set up. "But that's not the point. The USA is the leading stock exchange. Since Europe and Germany react similarly, the results can also be used to get recommendations for action for these exchanges."
In the middle of 2011, after two years of work, the model is ready. Der Kapitalmarktseismograf distinguishes between three regimes: a calm phase, a turbulent phase with positive yield expectations and a turbulent phase with negative prospects.
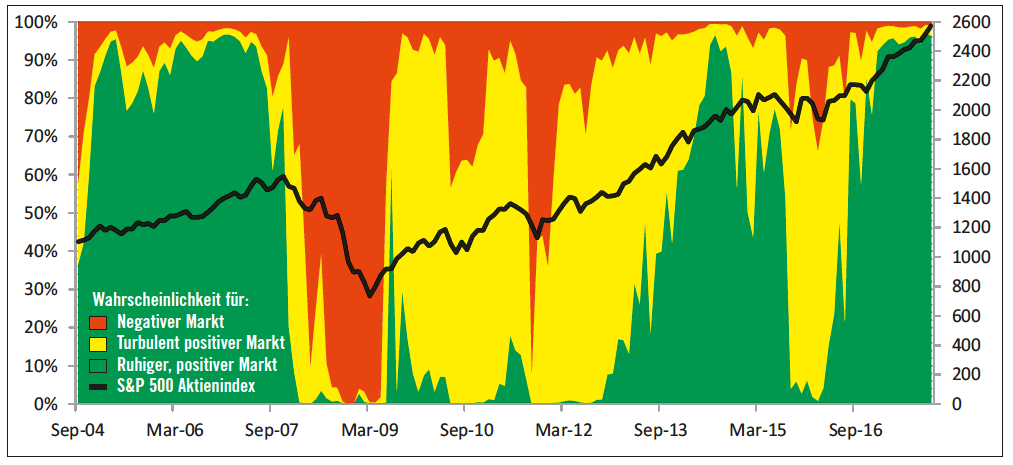
"We use the traffic light signals red, yellow and green," explains Rudi Zagst. "For me, green is the shopping phase. The sun is shining, there are no clouds in the sky to see. A crash is extremely unlikely. Investors can now essentially invest in equities without hedging. In turbulent phases, on the other hand, they should be more cautious. Then the stock market trend can turn in any direction. For me, turbulence-positive means investing, but not with flying flags. During this period, it makes sense to invest only part of the capital in shares. Or work with safeguards. Turbulence negative means: out of the market or full hedging. Then it's too dangerous."
The scientist tested the model retroactively with the current data from 2004 onwards. "The market was turbulence-negative until March 2004, then became calm and remained so until January 2008, after which a turbulence-negative state was indicated. Since July 2009, the market has been turbulently positive. To be invested from 2004 onwards, to sell in January 2008 and to buy again cautiously in summer 2009 would indeed not have been bad. We were obviously on the right track."
The model has been undergoing practical testing since the end of 2011. Since then, the results have been published monthly on the private wealth homepage. The model provided many extremely helpful hints. For example, the sustained upward trend from 2012 to mid-2015 was correctly anticipated. The subsequent correction phases were also predicted. What was remarkable was that the seismograph was always quickly turning into the positiven Bereich. This indicated a correction, not the beginning of a sustained downturn. This was a valuable piece of information for investors considering selling their shares at the time.
From mid-2016 on, the seismograph advised to remain fully invested despite Brexit, Trump and the various political thrillers in Europa . The further development proved him right again.
However, there were also two weaknesses. The advice was vague. The information was sufficient to sensitize um Investoren .However, there were no concrete, rule-based instructions for action regarding the allocation of securities accounts at Eine . Is a rise of the red probability by five points already a sell-signal? When does it really get dangerous?
And last but not least, the model was obviously too slow for practical use, since the probabilities were calculated only once at im Monat . Doch a crash does not wait.
Oliver Schlick begins to correct these weaknesses with the support of the scientists. "We first increased the signal frequency," says the banker. The challenge was to find the optimal sensitivity. One month interval between measurements was definitely too long. However, if measurements were taken every day, long-term trends could hardly be identified any more. "Four days apart have proven to be optimal. We are now fast enough to detect an approaching thunderstorm, but slow enough not to have to react to every gust of wind."
The second challenge was the concrete feasibility. "Our goal is to convert the predicted probabilities into rule-based weighting decisions. Which equity ratio is appropriate in which situation," explains Schlick. To achieve this, the financial professional turns two screws. The first has something to do with an investor's individual risk appetite. It defines the maximum share quotas for certain weather constellations. "This is the base allocation. There are investors for whom it is enough if the probability of a thunderstorm is less than 30 percent to be fully invested. Others want more security."
In the second step, the seismograph then provides indications of a dynamic change in the equity ratio. "If there's a percentage change in red within four days, something's obviously in the bush. Dark clouds move in quickly. Then it is advisable to sell shares", erklärt Oliver Schlick. The same applies if the red probability builds up significantly over a certain period without interruption. "So more and more clouds are forming and these are getting blacker and blacker. In this case too, investors should pull the rip cord."
Similar rules define when and in which steps investments are made again if the clouds disappear again. "It was about optimizing three things - we wanted to reduce the losses in downward movements, join the positive trend in upward phases and not produce a minus in sideways movements", erklärt Schlick. "Calibrated to these goals, a rule-based strategy could be developed that since 2004 has yielded more returns than pure equity investments. It also performed much better than various mixing strategies, with less variation and lower maximum losses during downturns."
The next step will be the commercial exploitation of these findings. "From pure consulting services to the management of funds to the input for a Robo Advisor, much is conceivable," says Schlick.

At the moment, the stock exchange professional - a trained economist - is waiting particularly eagerly for the seismograph's latest results. "I myself am quite sceptical about the stock markets. But the seismograph is deep green. That is the advantage of a synthesis of the quantitative and the fundamental world. Analysts and scientists tell the computer what to look for. He'll act completely unmoved. Regardless of the valuation of markets. Und without a doubt."
So far, the seismograph has pointed out major corrections to investors and given the all-clear again in good time. After six years of bull market, the next test is imminent. Will the model help to survive a major crash largely unharmed? "We will experience it in the next two years," Schlick suspects. "And then let you know immediately, damit Sie your readers can warn," promises Rudi Zagst: "Because that's what I was all about when I conceived the seismograph. To prevent investors from losing a lot of money on the stock market in every crisis."
____________________________
Making of - how the seismograph was created.
"The basis of our work is the realization that different rules apply in calm and turbulent stock market phases," explains Rudi Zagst (on the computer with Oliver Schlick (left) and employee Markus Wahl). "In the first step, a complex mathematical model looks around the world of capital markets and recognizes that this world can actually change. In turbulent phases, prices fluctuate sharply, equity markets are highly synchronized and yields are usually negative. In quiet phases it is exactly the other way round. The model is now learning to distinguish these phases."
Now the algorithm knows which regime the markets were in with what probability at a certain point in time in the past. He knows the historical turbulence probabilities. "At zweiten Schritt we tested 30 variables - market data as well as economic data - and processed them in mathematical models. The aim was to find the combination of factors with which the turbulence probability could best be mathematically explained in the past," explains Zagst.
A panel of experts, including Oliver Schlick, examined the input variables for their economic relevance and eliminated factors for which fictitious correlations could be assumed. "In the end, five variables remained: a global economic indicator, the LIBOR money market rate, the interest rate differential between prime and subprime bonds, price fluctuations and the structure of yield curves - the ratio of short-term interest rates to five- or ten-year yields.
In the third step, the model uses the current values for these variables and the probabilities of the last month to estimate the turbulence probability for the coming month. The model itself also learns. "With each new time slice, it is better able to distinguish between turbulent and non-turbulent states," Rudi Zagst makes clear: "At the same time, we regularly test in the background whether another combination of factors would not have produced better results as a result of this learning process. Because when the world changes, the seismograph has to evolve too."
____________________________
®
Author: Klaus Meitinger
{/mprestriction}